
I spent nine years in the back of dusty Land Cruisers across South Sudan and the DRC, watching people try to solve crises with nothing but glossy reports and expensive academic models. I’ve sat in briefings where consultants spent hours debating how multidimensional poverty is measured, throwing around terms like “deprivation indices” and “weighted indicators” as if the complexity of the math actually mattered. But let me tell you something I learned when a shipment of vaccines sat rotting in a warehouse because the “data” didn’t account for a washed-out bridge: a person isn’t “less poor” just because a decimal point moves on a spreadsheet. Complexity is often just a mask for inaction.
In this post, I’m stripping away the academic jargon to show you what actually happens when these metrics meet the real world. I won’t bore you with the theoretical elegance of the MPI or the nuances of various socioeconomic datasets. Instead, I’ll give you the unfiltered reality of how these measurements translate—or fail to translate—into actual resources on the ground. We are going to look at the gap between the data and the delivery, because at the end of the day, the numbers are useless if the supplies never reach the people they’re meant to serve.
Table of Contents
Why Measuring Non Monetary Poverty Changes Everything

I’ve spent enough years staring at fuel receipts and broken axles to know that a person’s life doesn’t change just because their daily income ticked up by fifty cents. You can hand a family a few extra dollars, but if they still have to walk six kilometers for a bucket of grey water or if the nearest clinic is a three-day trek through mud, they aren’t “out” of poverty. This is why measuring non-monetary poverty is the only way to see the actual terrain. When we look at the Multidimensional Poverty Index MPI, we stop pretending that cash is a magic wand and start looking at the structural walls that keep people trapped.
The real shift happens when we stop treating poverty as a single number and start looking at overlapping deprivations analysis. In my experience, deprivation rarely travels alone. If a child isn’t in school, it’s usually because the house lacks electricity to study at night or because the family is dealing with chronic malnutrition. By using these specific deprivation indicators explained through a multi-layered lens, we can see how one failure feeds into another. It moves the conversation from “how much money do they have?” to “what is actually missing from their lives?” That distinction is the difference between a well-meaning donation and a functional supply chain.
Beyond Income the Truth of Deprivation Indicators Explained
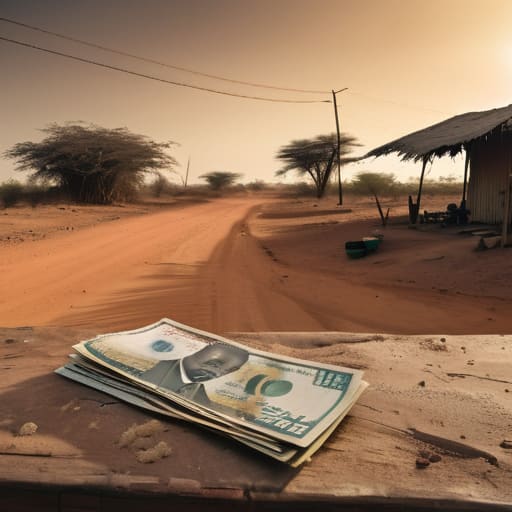
When I was working in South Sudan, I saw families who technically sat above the “poverty line” in terms of daily cash flow, yet they were effectively paralyzed by their surroundings. They had a few dollars for grain, but no access to a paved road, no electricity to store medicine, and no clean well within five kilometers. This is where the Multidimensional Poverty Index (MPI) actually becomes useful. It moves past the fallacy that a slightly higher daily wage solves everything. Instead, it looks at the specific, granular failures of a household’s environment.
When you look at deprivation indicators explained through a logistics lens, you realize that poverty isn’t a single hole you dig yourself out of; it’s a series of interconnected dead ends. You might have a roof over your head, but if you lack access to sanitation or basic schooling, your trajectory is already capped. We have to stop looking at people as mere data points on a wealth curve and start looking at them through overlapping deprivations analysis. If a child is malnourished and lacks access to clean water, the math of their survival changes entirely. It isn’t just about adding up deficits; it’s about understanding how these specific gaps cluster together to trap a community in place.
## The Gap Between Data and Delivery
You can spend all day debating the weight of a decimal point in a poverty index, but a person isn’t ‘less poor’ just because a spreadsheet says their indicators improved—they are better off when the actual resources move from the warehouse to the village.
Yusuf Lindqvist
The Metric is the Mission

We have spent this time dissecting the mechanics of multidimensional poverty—the way we look past a simple daily wage to track access to clean water, schooling, and basic nutrition. It is a necessary shift. If we only track dollars, we miss the reality that a family can have a small influx of cash but still be trapped in a cycle of deprivation because the nearest clinic is a three-day walk away. The data tells us that poverty isn’t just a lack of currency; it is a systemic failure of infrastructure and access. We cannot solve a problem we refuse to see in its full, messy complexity.
At the end of the day, these indices and indicators are just tools to help us aim our resources more accurately. I have seen too many well-intentioned projects fail because they focused on the sentiment of the need rather than the hard reality of the delivery. Measurement is important, but it is not the end goal. The real victory isn’t found in a beautifully formatted report or a rising decimal point on a poverty index; it is found when the logistics of dignity finally work. We measure so that we can act, and we act so that the resources actually reach the people they were meant for.